
Figure 2. The instrument configuration for proper detection of two common amine reactive dyes.
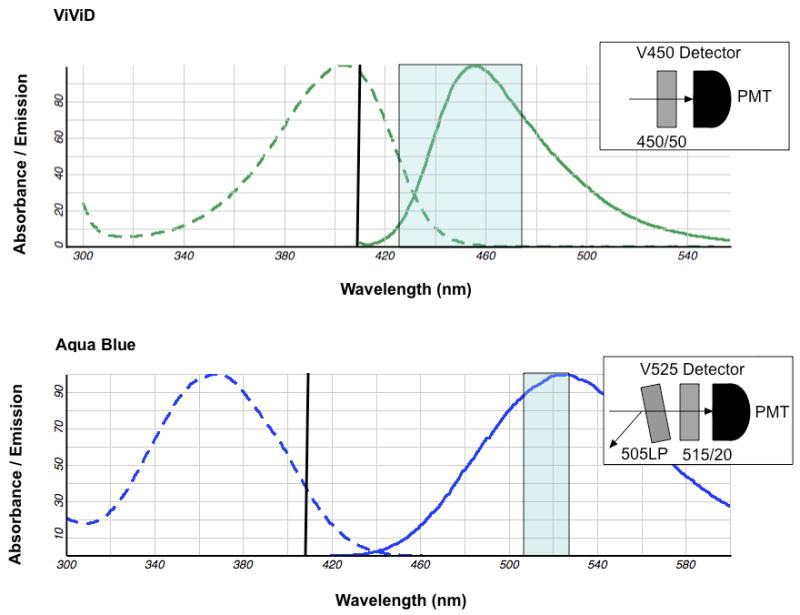
Figure 2 shows the excitation (dotted curve) and emission (solid curve) curves of the ViViD dye (upper panel) and the Aqua Blue dye (lower panel). These dyes are excited by the violet 408nm laser indicated by the black line over the excitation curve. Each rectangle shows band pass filter range of detection for the PMT as shown in each insert. In order to detect fluorescence from each emission curve the V450 detector uses only the 450/50nm band pass filter (upper insert) and the V525 detector uses a 505LP dichrolic filter combined with a 515/20nm band pass filter (lower insert).