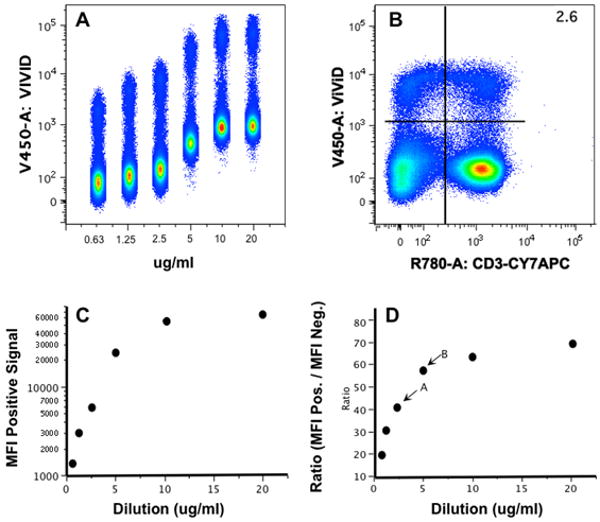
Figure 3. Titration of amine reactive dyes.

Figure 3 is a representative titration of the ViViD dye used in staining panels. Cells were incubated for 5 days under standard culture conditions and then stained with dilutions of ViViD dye (20, 10, 5, 2.5, 1.25 and 0.625ug/ml). After staining was complete, cells were stained with anti-CD3 using standard staining procedures. Gating on only CD3+ cells (live and dead) all dilutions can be concatenated on one histogram (figure 3A). This display can be used to measure the MFI of the negative and positive cell populations using the appropriate software. Figure 3B is a representative histogram of the working dilution of 2.5ug/ml of ViVID and anti-CD3. When considering the amine reactive dyes, the lowest background signal is more important than the absolute positive signal.
To illustrate the differences in the positive signal relative to the background staining, figure 3C (positive MFI) can be compared to the figure 3D (Ratio = pos. MFI / neg. MFI). The separation is acceptable at either of the lower dilutions (2.5 or 5ug/ml), however since the background is lowest at 2.5 ug/ml (arrow A) as compared to 5ug/ml (arrow B) the lower dilution is best.
