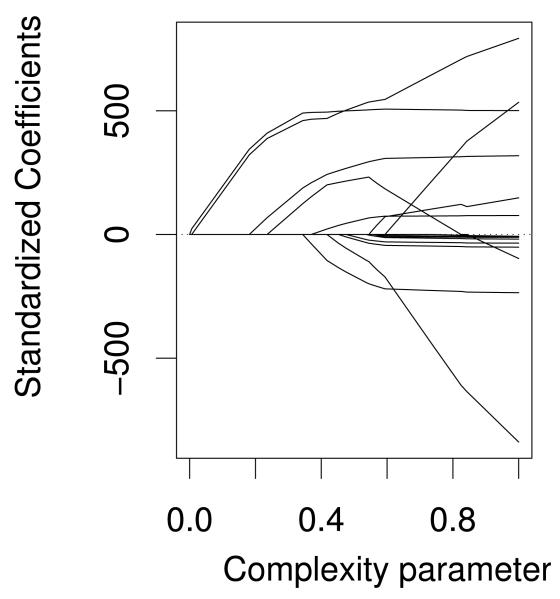
Figure 1.
Family of Solutions from the Lasso Algorithm. As the complexity parameter increases, SNPs are enter into (or drop out of) the model, one by one. Likewise, the complexity parameter determines the attenuation factor. At 0, all coefficients are 0. As the complexity parameter increases, the lasso coefficients approach the least squares solution. The traces plot each standardized coefficient as it enters the model and becomes less attenuated. Using cross-validation, a complexity parameter is selected that corresponds to a particular solution chosen from the family of solutions.

