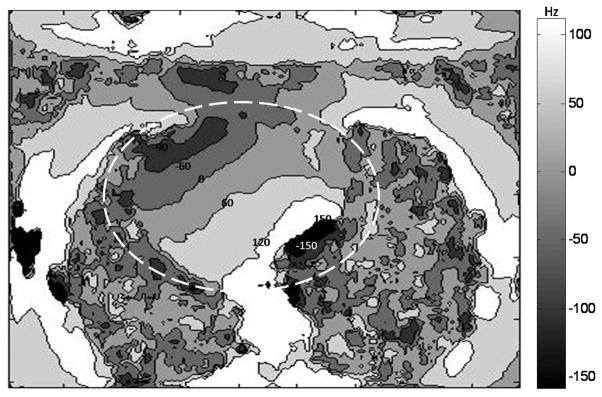
Figure 4.
Off-resonance frequency map with contour lines in one sample slice from a volunteer. A low-pass filter was applied to the frequency map before contouring to reduce the sharp phase change in the region of air. Frequency ranges from -167 Hz to 149 Hz in the heart region (the dashed circle) of this chosen slice.

