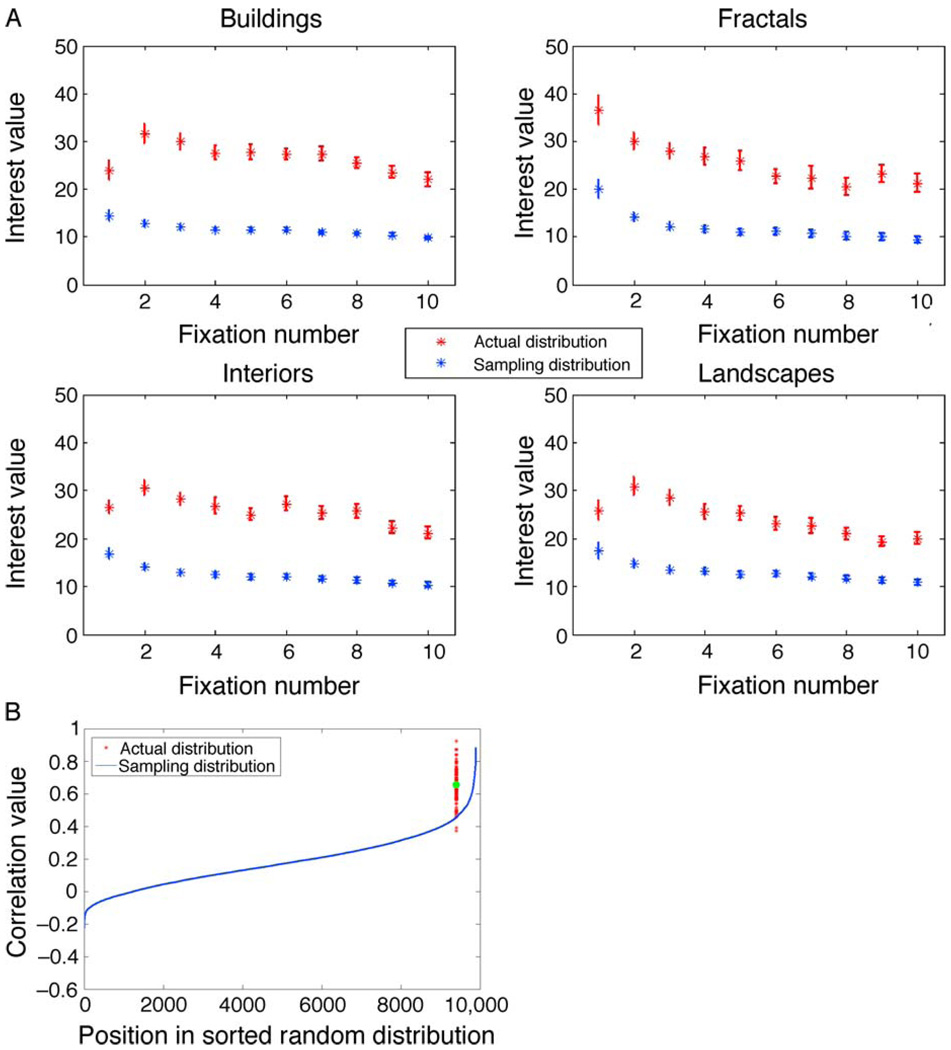
Figure 10.
(A) Mean interest values at different fixation locations for the four image types and the actual and chance sampling distributions. Error bars represent plus and minus one standard error. Note that the distance between the actual and chance sampling distributions represents the chance-adjusted interest value. (B) Cross-correlation between fixation maps and interest maps. Values from the random cross-correlation distribution are sorted from weakest to strongest and from negative to positive correlations. The mean value of the actual distribution is plotted in green.

