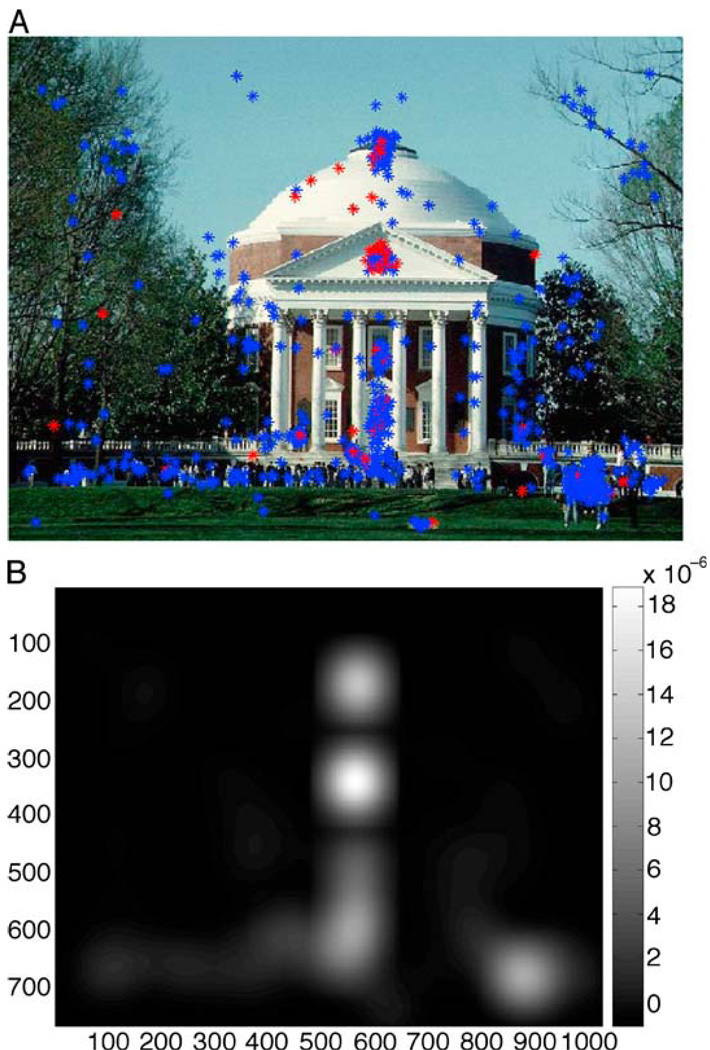
Figure 7.
Creation of interest maps. (A) Original image with interest points plotted on top. Color coding as in Figure 3. (B) Interest selections with Gaussian intensity “blobs” centered on each interest point and superposed. Values have been normalized such that the sum of all values equals unity, and the overall mean has been subtracted.

