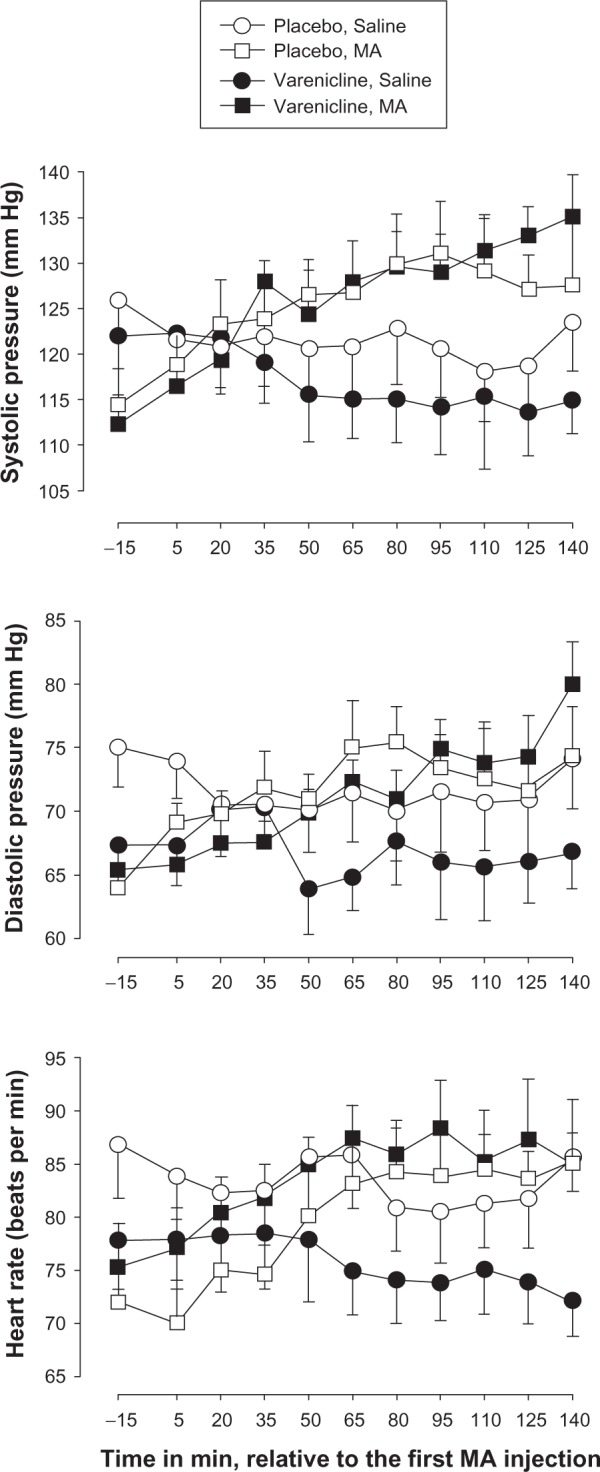
Figure 1.

Time-course of effects of methamphetamine (MA) and saline varenicline or placebo maintenance on systolic pressure (top panel), diastolic pressure (middle panel) and heart rate (bottom panel).
Notes: The data collected during infusion sessions in phase I (day 9) and phase II (day 7) are shown. X-axis: Time in min, relative to the first MA infusion. Data are expressed as mean of eight participants. Unidirectional brackets indicate one standard error of mean.
