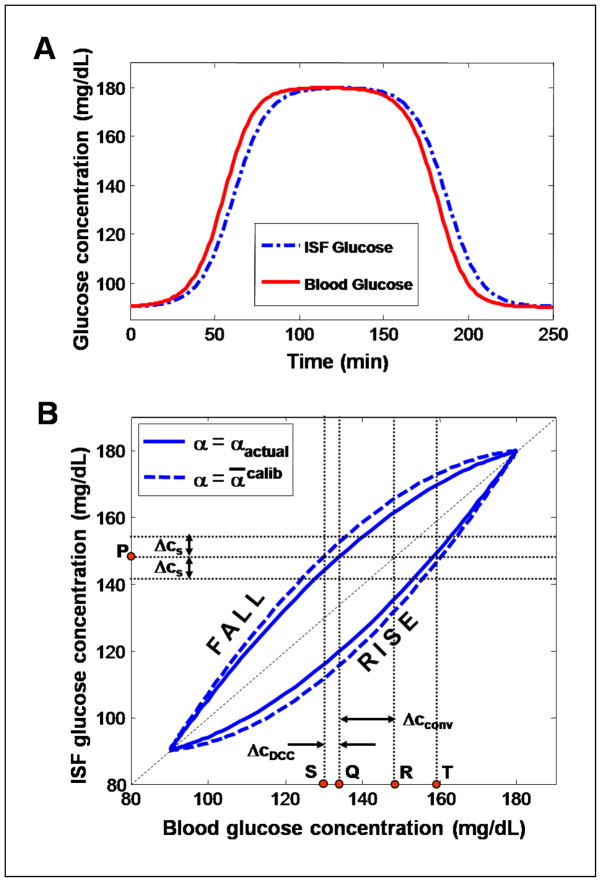
Fig. 2.
(A) A schematic representation of blood and ISF glucose concentration profiles, similar to those obtained during a typical tolerance test. (B) Plot of the ISF vs. blood glucose concentrations shown in panel (A). The solid line curve shows the lack of one-to-one correspondence between the actual ISF and blood glucose relationship, while the dotted line curve represents the approximate relationship estimated by the DCC model. Further details are provided in the text.

