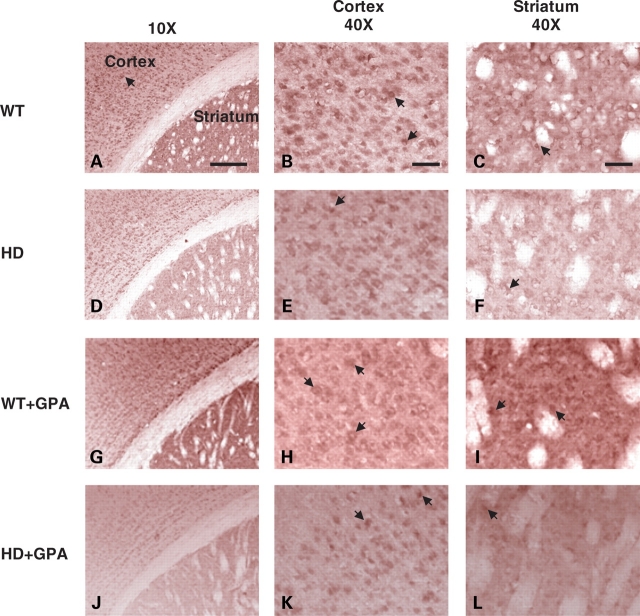
Figure 3.
PGC-1α immunoreactivity in the brain. PGC-1α immunoreactivity in the cortex and the striatum of untreated WT (A–C), untreated HD (D–F), GPA-treated WT (G–I) and GPA-treated HD (J–L) mice. The HD mouse brain shows reduced immunoreactivity compared with WT, particularly in the striatum. GPA treatment of WT mice enhanced PGC-1 α immunoreactivity in the cortex and the striatum. GPA treatment of HD mice also increased PGC-1α immunoreactivity in the cortex and the striatum but to a lesser extent than WT mice. Scale bar = 150 µm.

