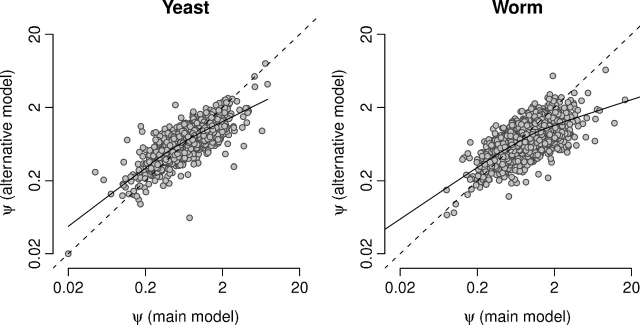
FIG. 5.
Evolutionary rate ratio ψ for the model described in the main text and for the alternative model described in the Supplementary Material online for yeast (left) and worm (right). The Spearman correlations for the two data sets are 0.715 (P≪10 − 100) for yeast and 0.694 (P≪10 − 100) for worm. The solid lines show lowess smoothed data and the dashed lines indicate exact agreement between the two models.

