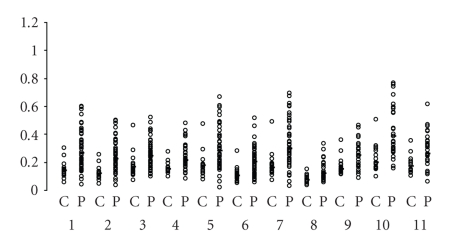
Figure 2.
Scattergrams represent the OD values for AD patients (P) and controls (C) for each conjugate (statistically significant) and isotype (statistically significant). The first lane of OD values corresponds to C and the second to P. IgA for: (1) 3-OHKyn, (2) Kyna, (3) Quina, (4) 3-OHAnthra, (5) Anthra, (6) Xantha, (7) Pico, (8) 5-HT, (9) Mel, (10) 5-HIAA, and (11) 5-MTol.

