FIGURE 1.
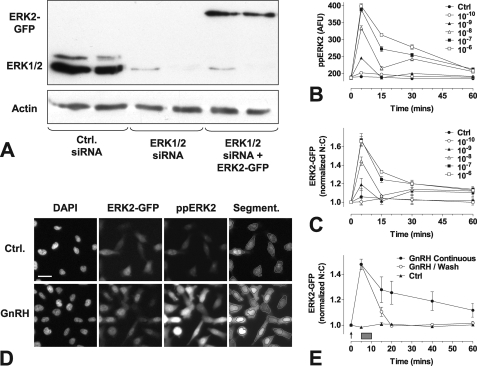
Image-based assays of GnRH-mediated ERK signaling. Panel A, HeLa cells were grown in 6-well plates, transfected with control siRNAs (Ctrl) or ERK1/2 siRNAs, and transduced with Ad mGnRHR with or without Ad ERK2-GFP as indicated. Cells were processed for Western blotting with antibodies targeting total ERK1/2 or β-actin, as described under “Experimental Procedures.” The position of bands showing ERK1/2 and ERK2-GFP were determined by comparison with molecular weight markers. Results are representative of three similar experiments. Panels B and C, cells were plated in 96-well plates and subject to siRNA knockdown of ERK1/2 then transduced with Ad-mGnRHR and Ad-ERK2-GFP before serum starvation overnight. Cells were stimulated with GnRH at the indicated times and molar concentrations before fixation, immunocytochemical staining, and image analysis as described under “Experimental Procedures.” Panel D, cells were treated as above, and representative images are shown before and after treatment with GnRH (10−6 m, peak response shown) for the ppERK2 and ERK2-GFP image channels, with an example of the automated image segmentation. Scale bar, 30 μm. Panel E, cells were plated as above, then stained with Hoechst dye and treated with 10−7 m GnRH at the indicated time points either continuously or for 5 min followed by repeated wash (gray rectangle). Live cell image acquisition and analysis was performed as described under “Experimental Procedures.” Data shown are ppERK fluorescence intensity in arbitrary fluorescence units (AFU) or N:C ratio of ERK2-GFP fluorescence intensity (background subtracted) normalized as the -fold change over control. Results shown are the mean ± S.E. of 3–8 independent experiments. For panel E, statistical analysis by two-way ANOVA indicates that treatment type (brief versus sustained) is a significant source of variation (p < 0.001, F1,68 = 22.49), as is time (p < 0.001, F5,68 = 30.32), and the interaction (p < 0.05, F5,68 = 2.92).

