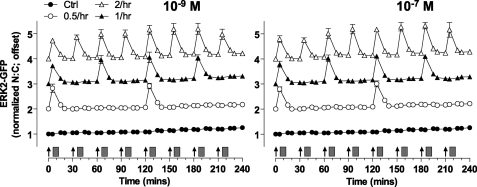
FIGURE 3.
Live cell imaging with varied GnRH pulse frequency. Cells were subject to siRNA knockdown of ERK1/2 and transduced with Ad-NLS-BFP, Ad-mGnRHR, and Ad-ERK2-GFP before serum starvation overnight. Cells were treated (for 5 min) with 10−7 or 10−9 m GnRH at 30-min, 1 h, or every 2 h as indicated. As a control (Ctrl), all wells were subject to half-hourly washes (gray rectangles) 5 min after the GnRH addition. Live cell image acquisition and analysis was performed as described under “Experimental Procedures.” Data shown are the N:C ratio of ERK2-GFP fluorescence intensity (background subtracted), normalized as the -fold change over control (at 0 min) and offset by +1, 2, or 3 (for 0.5-, 1-h, and 2-h intervals, respectively). Results shown are the mean ± S.E. of three independent experiments.

