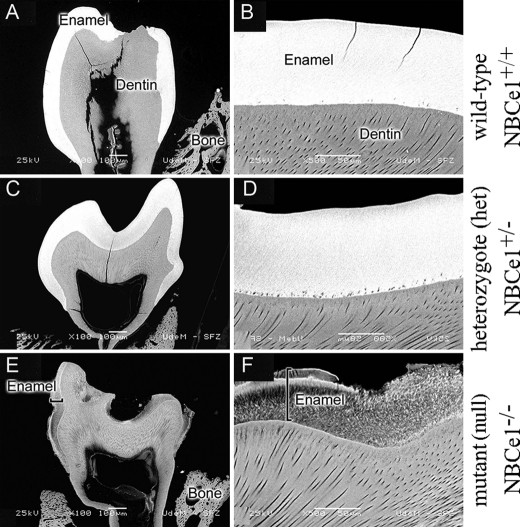
FIGURE 8.
Backscattered scanning electron microscope (SEM) imaging of NBCe1 mutant animals. Backscattered SEM image of first mandibular molars of NBCe1+/+ (A and B), NBCe1+/− (C and D), and NBCe1−/− animals (E and F) showing a significantly lower signal in the NBCe1−/− animals indicative of extremely poor mineralization of the enamel (F). Scale bars are shown in each panel.

