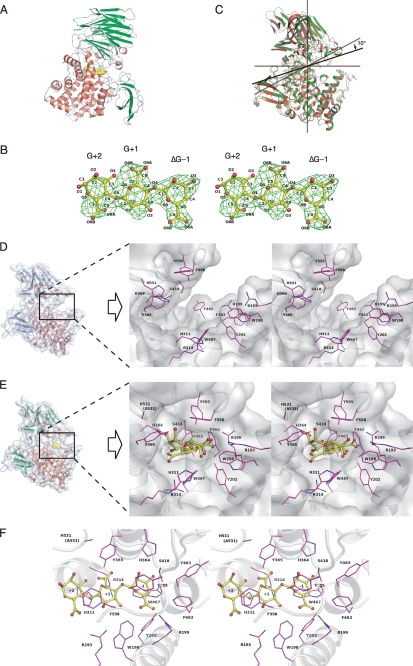
FIGURE 3.
Active site structure of Atu3025. A, overall structure of H531A/ΔGGG. B, electron density of the ΔGGG molecule in the active pocket by the omit map (Fo − Fc) calculated without ΔGGG and countered at 3.0 σ. C, superimposition of ligand-free Atu3025 (red) and H531A/ΔGGG (green). D, surface model and active site structure (inset, stereodiagram) of the ligand-free Atu3025. E, surface model and active site structure (inset, stereodiagram) of H531A/ΔGGG. F, residues in the H531A/ΔGGG structure interacting with the ΔGGG molecule in the active pocket. Amino acid residues and ΔGGG molecule are shown by colored elements: oxygen atom, red, carbon atom, pink in amino acid residues, and yellow in the ΔGGG molecule; nitrogen atom, deep blue. Characters in panel B indicate the saccharide number and its atoms. Characters in panels D–F indicate the subsite and amino acid residue numbers.

