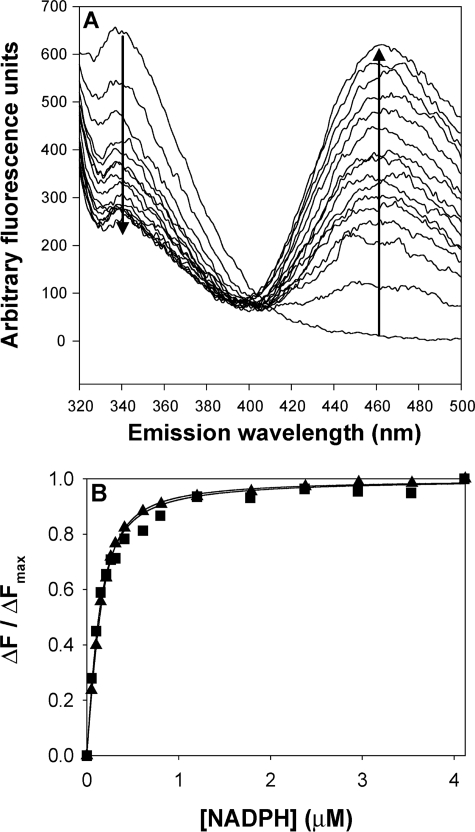
FIGURE 3.
Titration of the fluorescence emission spectra of AKR1D1 with increasing [NADPH]. A, emission spectrum of recombinant AKR1D1 excited at 295 nm following the addition of increasing concentrations of NADPH from 0 to 4 μm. A decrease in emission is seen at 340 nm, and an increase in emission is seen at 460 nm. B, plot of ΔF/ΔFmax versus [NADPH], wild type (■), and P133R (▴).

