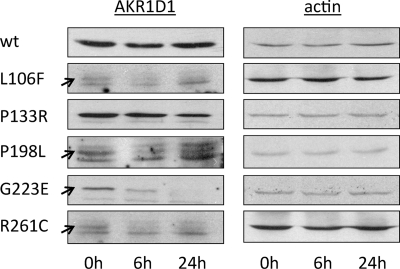
FIGURE 6.
Protein expression and stability of AKR1D1 and its natural mutants in transfected HEK 293 cells. Cells were collected at 0, 6, and 24 h following treatment with cycloheximide, and AKR1D1 enzymes were detected by Western blot with a polyclonal anti-AKR1D1 antibody. Blots were stripped and reprobed with antibodies against β-actin to confirm equal loading within an individual experiment. Variations in signal intensity across different constructs are due to differences in exposure time. The arrows point to the signals corresponding to the mutants L106F, P198L, and R261C, that expressed at such low levels that background bands appeared due to increased exposure time.

