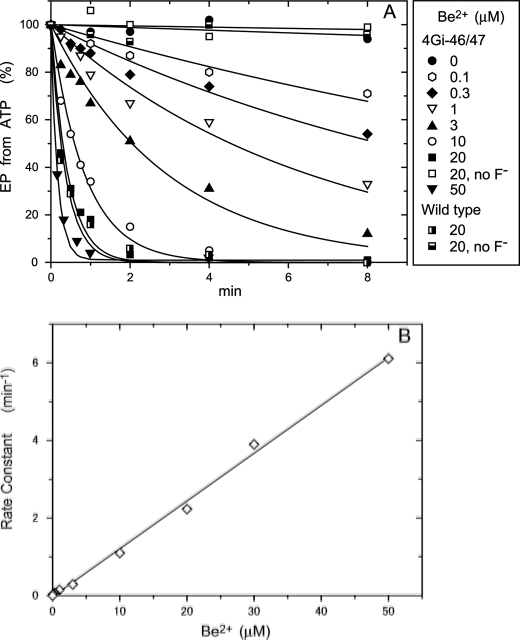
FIGURE 4.
Be2+ dependence of the rate of EP inhibition by BeFx in 0.01 mm Ca2+. A, microsomes expressing the wild type or mutant 4Gi-46/47 were incubated for various periods in 0.01 mm Ca2+ and 1 mm KF with various concentrations of BeSO4 and otherwise as in Fig. 3, A and C, for BeFx-treatment. The samples were then diluted 10-fold and phosphorylated with 10 μm [γ-32P]ATP, and the amount of EP formed was determined, as in Fig. 3, A and C. Solid lines show the least squares fit to a single exponential. In B, the rate constants obtained in A were plotted versus the concentration of Be2+ added. The linear fit to the data gave a slope of 0.123 min−1μm−1.

