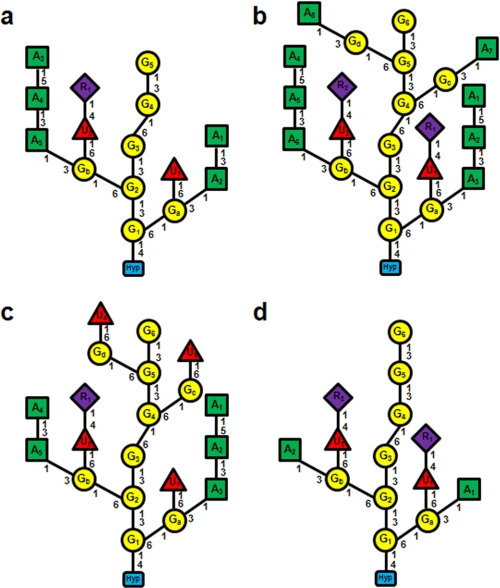
FIGURE 5.
Comparison of the primary structures of Hyp-AGs. a, Ala-Hyp-polysaccharide-1 (15). b, interferon Hyp-polysaccharide-1. c, interferon Hyp-polysaccharide-2. d, Ala-Hyp-polysaccharide-2. The yellow circles indicate β-d-Galp residues, the green squares indicate α-l-Araf, the purple diamonds indicate α-l-Rhap, the red triangles indicate β-d-GlcUAp, and the blue blocks indicate Hyp. The residue labels inside the shapes (A3, G1, etc.) correspond to the residues described under “Results,” Fig. 4, and the supplemental Tables I–V.

