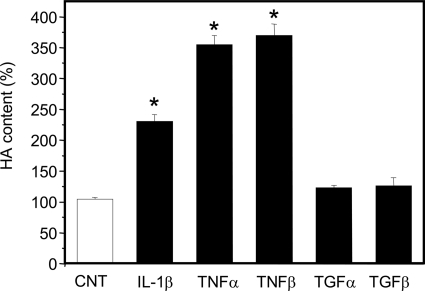
FIGURE 2.
Effects of several cytokines on HA biosynthesis in HUVECs. Relative quantification by HPLC of ΔHA secreted into the culture medium in untreated (CNT, white bar) and 24-h treated (black bars) cells with 5 μg/ml of IL-1β, 0.1 μg/ml of TNF-α, 0.3 μg/ml of TNF-β, 1 μg/ml of TGF-α, and 0.01 μg/ml of TGF-β. Results are expressed as mean ± S.E. *, p < 0.01 control versus treated samples.

