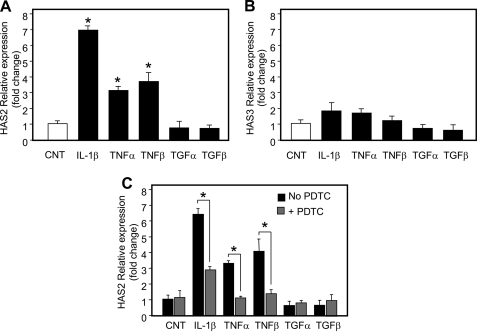
FIGURE 3.
Gene expression alteration after treating HUVECs with cytokines. Relative quantification of transcripts coding for HAS2 (A) or HAS3 (B) in untreated (CNT, white bar) and after 24 h treated (black bars) cells with 5 μg/ml of IL-1β, 0.1 μg/ml of TNF-α, 0.3 μg/ml of TNF-β, 1 μg/ml of TGF-α, and 0.01 μg/ml of TGF-β. The lowest HAS2 or HAS3 mRNA level in three different untreated samples was set at 1, and the S.E. is shown on each bar. *, p < 0.01 control versus treated samples. C, relative quantification of HAS2 mRNA was done after cytokines exposure in the presence (gray bars) or absence (black bars) of PDTC (final concentration, 2 μm). The lowest HAS2 mRNA level in three different untreated samples was set at 1, and the S.E. is shown on each bar. *, p < 0.01 PDTC-untreated versus PDTC-treated samples.

