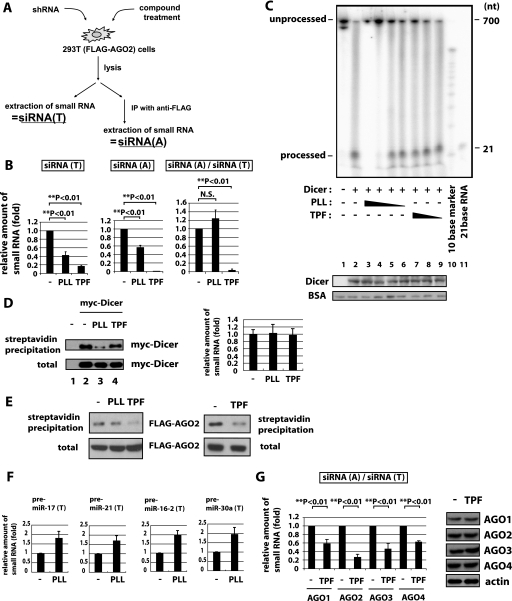
FIGURE 2.
PLL and TPF inhibit small RNA biogenesis/silencing in different ways. A, schematic representation of the experimental procedure for recovering shRNA produced small RNAs in AGO2-IP and total cell fractions. 293T(FLAG·AGO2) cells after shRNA transfection and treatment with compounds were lysed and equally divided and then immediately extracted for total small siRNAs (siRNA(T); left). The lysate was also subjected to immunoprecipitation with anti-FLAG followed by the extraction of small AGO2-associated siRNAs (siRNA(A); right). B, siRNA(T) and siRNA(A) were extracted as described in A from 293T(FLAG·AGO2) cells treated with PLL, or TPF, or untreated cells (−). The amount of processed sh-GFP (si-GFP) was measured by real-time RT-PCR. The relative ratio of si-GFP in sRNA(T) (si-GFP(T), left) and that in sRNA(A) (si-GFP(A), center) from control-, PLL-, or TPF-treated cells was calculated using cells without treatment (−) set as 1. To quantify AGO2 association of si-GFP, the si-GFP(A) value was normalized by dividing with the si-GFP(T) value and graphed (right). The association of si-GFP with AGO2 (siRNA(A)/siRNA(T)) in cells treated with TPF was reduced compared with control (−) or PLL treated cells. C, in vitro Dicer assay. Various amounts of PLL (8, 4, 2, and 1 μm in lanes 3–6) or TPF (100, 10, and 1 μm in lanes 7–9) were added to the reactions. The substrate (unprocessed) and processed 32P-labeled RNAs were visualized. The presence of a “processed” band measures the Dicer enzymatic activity. The lower panel shows the amount of immunoblotted Dicer protein in each lane. Bovine serum albumin carrier protein was also blotted in each sample as a loading control. The addition of PLL, but not TPF, decreased Dicer-mediated processing of the ∼700 nt to the ∼21 nt band. D, in vitro RNA binding assay. 293T cells overexpressing myc-Dicer were treated with PLL (lane 3), TPF (lane 4), or untreated (lane 2). 293T cells, which do not express myc-Dicer, were used as a negative control (lane 1). Lysates from these cells were incubated with biotinylated pre-let-7a RNA and then precipitated with streptavidin-Sepharose. In the left panel, myc-Dicer was detected in the precipitates by immunoblotting (top). Total myc-Dicer in each sample was measured by immunoblotting at the bottom (total). In the right panel, total pre-let7a RNA in the samples used for lanes 2–4 of the left panel was quantified by real-time RT-PCR in three replicates. E, siRNA association with AGO2 after PLL or TPF treatment. 293T(FLAG·AGO2) cells treated with PLL or TPF or untreated (−) were lysed and mixed with biotinylated si-GFP RNA (left panels). si-GFP-containing complexes were captured with streptavidin beads (top) or left unprecipitated (bottom) and detected for FLAG·AGO2 by immunoblotting. siRNA association with AGO2 was reduced in lysates from cells treated with TPF but not PLL. Separately, an RNA precipitation assay with transfected RNA was performed (right panels). 293T(FLAG·AGO2) cells were transfected with biotinylated si-GFP, and cells were treated with TPF or were untreated. The cells were lysed and captured with streptavidin beads (top) or left unprecipitated (bottom) for detection of FLAG·AGO2. F, pre-miR-17, -21, -16–2, and -30a in total RNA fraction were quantified by real-time RT-PCR in 293T cells treated with PLL or untreated (−). G, 293T cells overexpressing FLAG·AGO1, -2, -3, or -4 were transfected with sh-GFP and treated with TPF or untreated (−). Left, the ratios of siRNA(A)/siRNA(T) were quantified as in Fig. 2B. Right, AGO1, -2, -3, or -4 expression was immunoblotted using anti-FLAG antibody. Anti-actin was used as a loading control.

