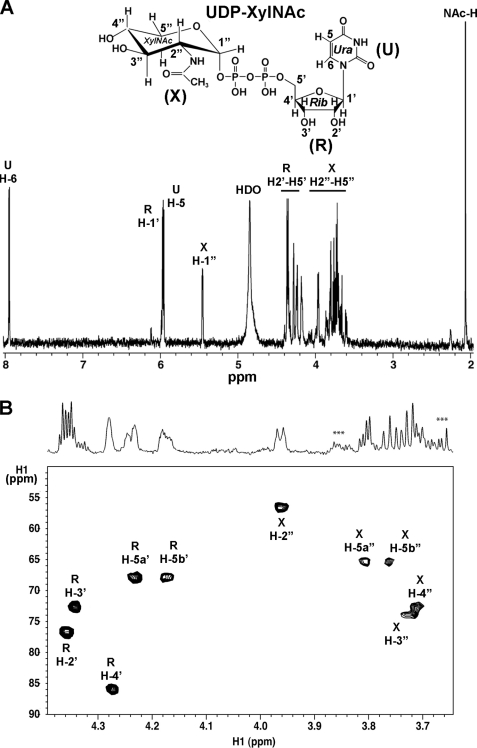
FIGURE 5.
One- and two-dimensional 1H NMR analyses of the UXNAcS enzymatic product, UDP-XylNAc. A, one-dimensional 900-MHz NMR spectrum of the enzymatic product collected from the HPLC column (see Fig. 4B, panels 2 and 3, asterisk). The chemical shift of each proton residue on the spectrum is indicated; the positions of protons on the uracil (U) ring are indicated by H, the ribose (R) protons by H′, the XylNAc (X) protons by H″, and the C″-2 linked acetamido protons by NAc-H. The peak marked as HDO is the residual water signal. B, two-dimensional 900-MHz NMR spectrum of UDP-XylNAc. The selected region of a carbon-proton HSQC shows the ring protons and carbons of XylNAc and ribose, with the corresponding region of the proton spectrum above. ***, peaks corresponding to column impurities.

