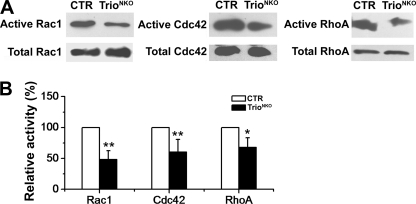
FIGURE 9.
Quantification of active Rho small GTPases. A, GTP-bound Rac1, Cdc42, and RhoA were pulled down using PBD-GST (Rac1 and Cdc42) and RBD-GST (RhoA) from lysates of CTR and mutant total brain at P0.5. Active Rac1, Cdc42, and RhoA pulldown assays were detected by Western blot using antibodies against Rac1, Cdc42, and RhoA, respectively. Total Rac1, Cdc42, and RhoA in cell lysates indicated equal amounts of the GTPases (bottom). B, the histogram shows that the rate of active Rac1, RhoA, and Cdc42 was significantly reduced in mutant mice (p = 0.001 for Rac1, n = 5; p = 0.009 for RhoA, n = 5; p = 0.03 for Cdc42, n = 4); *, p < 0.05; **, p < 0.01.

