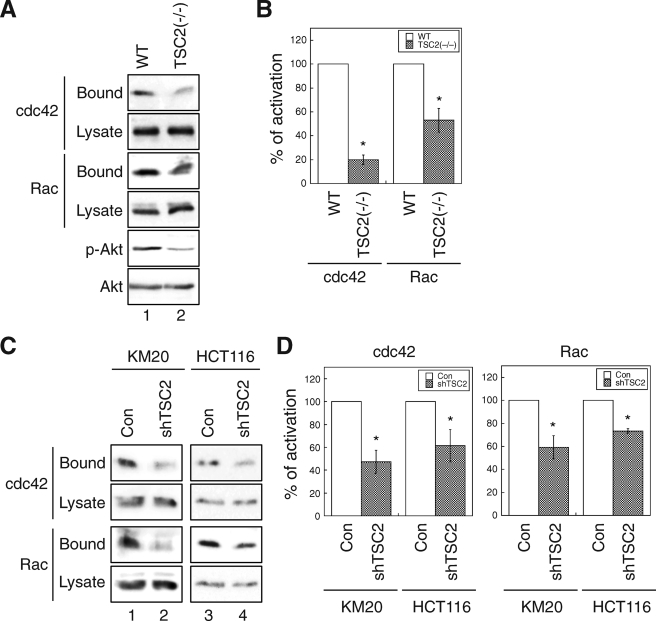
FIGURE 4.
Loss of TSC2 expression represses the activation of CDC42 and RAC1. A, WT and TSC2(−/−) REF cells were analyzed for CDC42 and RAC1 activation using GST-PBD pulldown assays. The amount of activated and total CDC42 and RAC1 in the cells were detected using the anti-CDC42 and anti-RAC1 antibodies on Western blots. The GST-PBD bound panels represent the activated fraction of CDC42 and RAC1, and 10% of cell lysates were used to show the total expression of CDC42 and RAC1 (Lysate panels). The p-Akt panel shows the phosphorylation level of AKT at Ser473 in the cell lysates. B, the percentage of activation was quantified by normalizing the level of activated CDC42 and RAC1 (Bound panels) to the total proteins in the lysates (Lysate panels). Data shown in the graph represent the mean ± S.E. (n = 3; *, p < 0.05). C, the control and TSC2 knockdown colon cancer cells, including KM20 and HCT116, were analyzed for CDC42 and RAC1 activation using GST-PBD pulldown assays. The activated and total CDC42 and RAC1 were analyzed as in A. D, the percentage of activation was quantified by normalizing the level of activated CDC42 and RAC1 (Bound panels) to total proteins in the lysates (Lysate panels). Data shown in the graphs represent the mean ± S.E. (n = 4; *, p < 0.05).

