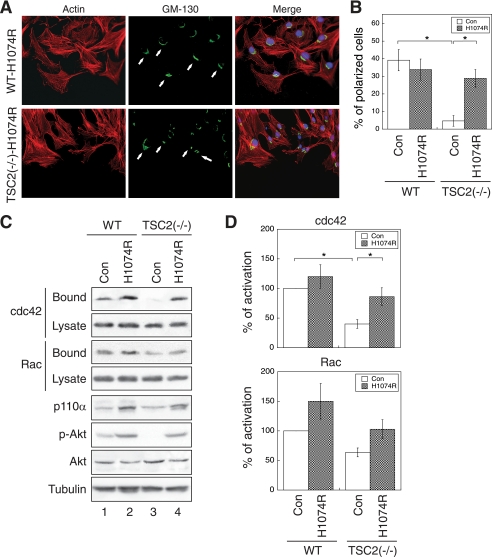
FIGURE 7.
Overexpression of an active p110α mutant of PI3K rescues the polarization and CDC42/RAC1 activation defects in TSC2(−/−) REF cells. A, WT and TSC2(−/−) REF cells infected with control (Con) retrovirus or a retrovirus encoding an oncogenic activating mutant of p110α, H1047R, were subjected to polarization assays as described in Fig. 2. The cells were stained with the anti-GM-130 antibody and visualized using the Alexa488-conjugated secondary antibody (GM-130 panels). The actin was visualized with Texas Red-conjugated phalloidin (Actin panels). The nuclei were stained with 4′,6-diamidino-2-phenylindole. The scratch wounds were located parallel to the bottom of each image. The polarized cells with Golgi facing the wound are marked with solid arrows. B, shown are the quantitative results showing the percentage of polarized cells. For each experiment, six to eight images were taken along the scratch, and 100–120 total cells located at the edge of the wound were counted. The cells with Golgi orientated facing the wound are considered polarized. Data represent the mean ± S.E. (n = 3; *, p < 0.05). C, the control and p110α-H1047R-infected WT and TSC2(−/−) REF cells were analyzed for CDC42 and RAC1 activation using GST-PBD pulldown assays. The amount of activated and total CDC42 and RAC1 in the cells were detected using the anti-CDC42 and anti-RAC1 antibodies on Western blots. The GST-PBD bound panels represent the activated fraction of CDC42 and RAC1, and 10% of cell lysates were used to show the total expression of CDC42 and RAC1 (Lysate panels). The expression of p110α in the cell lysates was detected using the anti-p110α antibody. The p-AKT and AKT panels show the phosphorylation level of AKT at Ser473 and total AKT expression, respectively. D, the percentage of activation was quantified by normalizing the level of CDC42 and RAC1 activation (Bound panels) to total proteins in the lysates (Lysate panels). Data shown in the graphs represent the mean ± S.E. (n = 3; *, p < 0.05).

