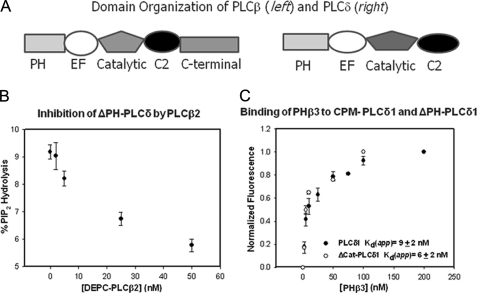
FIGURE 1.
A, domain organization of PLCβ and PLCδ enzymes. B, a graph illustrating the inhibition of PLCδ1 with PLCβ2. This experiment shows the decrease in the activity of 10 nm ΔPH-PLCδ1 with the addition of full-length PLCβ2 where the substrate, PI(4,5)P2, was dispersed in 20 mm sonicated vesicles composed of phosphatidylcholine:phosphatidylethanolamine:phosphatidylserine with 5% PIP(4,5)2. C, a graph illustrating the binding of PHβ3 to full-length CPM·PLCδ1 and CPM-ΔPH-PLCδ1, where association was assessed by the normalized change in fluorescence intensity, which averaged 18% for CPM·PLCδ1 and 11% for CPM-ΔPH-PLCδ1. For both sets of data, n = 3 and standard deviation is shown. A compilation of these data can be found in Table 1.

