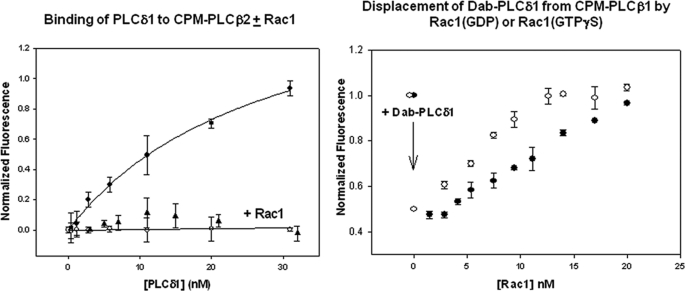
FIGURE 2.
Left, binding of PLCδ1 to CPM·PLCβ2 in the absence (●) and presence (▴) of 5 nm Rac1 (GTPγS) or 10 nm Rac1 (GDP) (○), n = 4, where the total change in CPM fluorescence ranged from 40 to 80% in each of the studies. Right, disruption of PLCβ2·PLCδ1 complexes by Rac1. Here, Dab-PLCδ1 was added to CPM·PLCβ2 so that 50% of the FRET complex was formed as indicated by the arrow and shown by the loss in CPM donor fluorescence to the non-fluorescent Dab acceptor. Afterward, either activated (○) or deactivated (●) Rac1 was added until the full, dissociated CPM·PLCβ2 fluorescence intensity was recovered.

