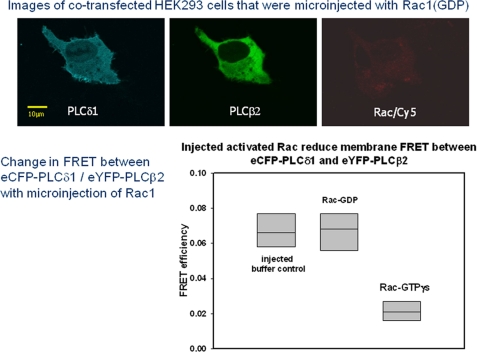
FIGURE 6.
Change in FRET between eCFP-PLCδ1 and eYFP-PLCβ2 in HEK293 cells with microinjection of Rac1. Top, images a cell showing expression of eCFP-PLCδ1 (left), eYFP-PLCβ2 (middle) that has been microinjected with Rac1(GDP) as seen by the fluorescence of the Cy5 tracer dye (right). Note that, although two cells in the image were microinjected, only one shows fluorescent PLC expression. Bottom, compilation of data showing a lack of change in eCFP-PLCδ1/eYFP-PLCβ2 FRET with microinjection of buffer or Rac1(GDP) but a loss in FRET with microinjection of Rac1(GTPγS). In the plot shown, the boxes contain 25 and 75% of the data, whereas the vertical line shows 5 and 95% of the data. The points are the absolute high and absolute low points. The line in the box is the median of the data, where n = 7–12.

