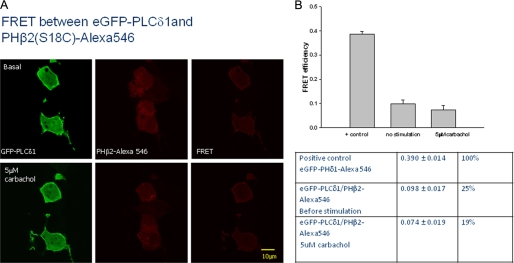
FIGURE 7.
Demonstration of FRET between eGFP-PLCδ1 expressed in HEK293 cells and microinjected PHβ2(S18C)-Alexa546. A, images showing cells expressing eGFP-PLCδ1 (left panels) that were microinjected with PHβ2(S18C)-Alexa546 (middle panels). The right panels are the FRET images corrected for GFP and Alexa546 bleedthrough. The bottom panels show the cells 60 s after addition of 5 μm carbachol suggesting a lack of movement of the PHβ2 domain with stimulation and a lack of significant changes in FRET. B, compilation of values in the bar graph and table form where n = 5 and ±S.D. is shown.

