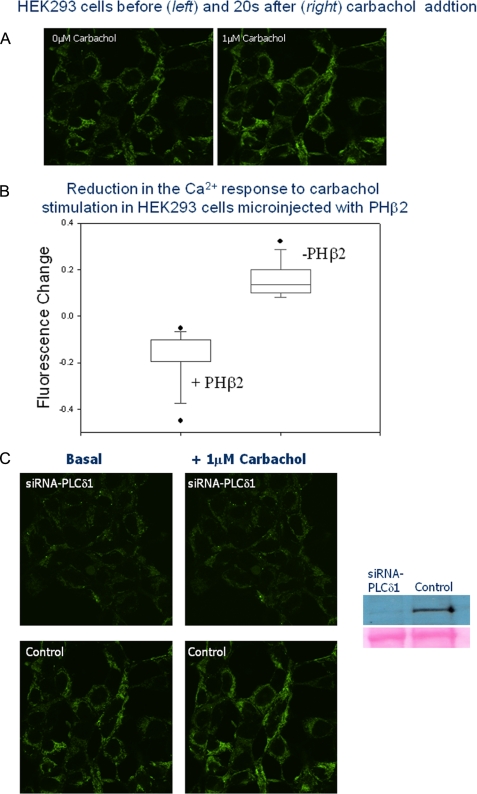
FIGURE 8.
A, example of the change in Calcium Green intensity of a HEK293 cells 20 s after stimulation. B, the response of untransfected HEK293 cells that were either not microinjected (n = 12) or microinjected only with tracer dye (Cy5) in buffer (n = 5) (these data were indistinguishable), as compared with cells that were microinjected with unlabeled PHβ2 and Cy5 tracer (n = 13). C, small interference RNA-PLCδ1 treatment of HEK293 cells results in an approximate 80% reduction of endogenous PLCδ1 as seen by Western blotting, and elimination of a significant response of Calcium Green intensity to 1 μm carbachol where cells were imaged 10 s after stimulation.

