
Figure 4.
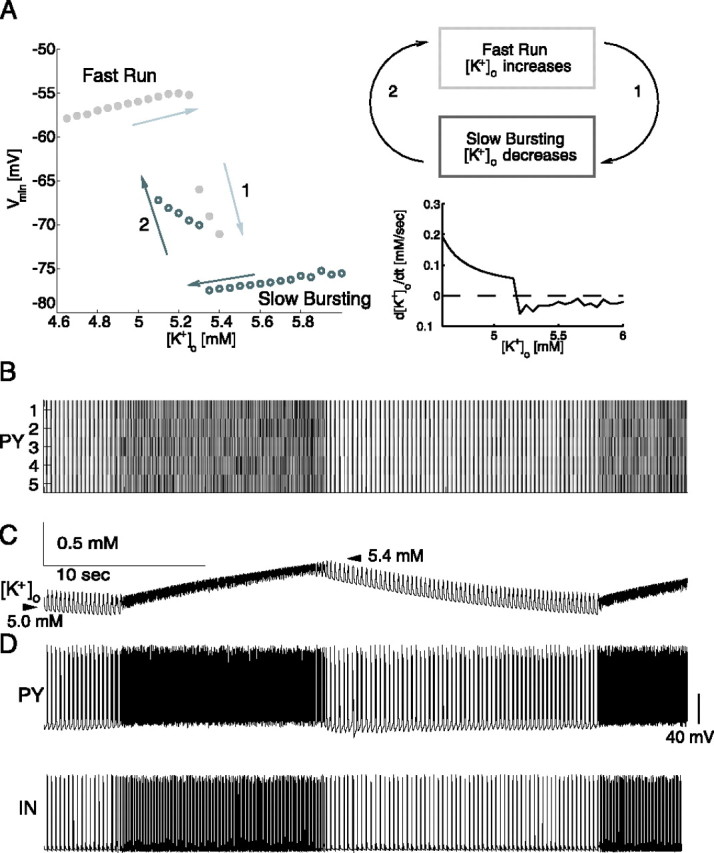
Globally connected network with five PY cells and one IN. A, Left, Bifurcation analysis (minimum of membrane voltage): hysteresis between fast run and slow bursting for [K+]o between 5.0 and 5.4 mm. Circles denote stable limit cycle oscillations. Top right, Schematic of slow periodic network dynamics. Bottom right, Averaged [K+]o change rate as a function of [K+]o. B–D, Slow transitions after initial brief increase in [K+]o. B, Network activity of PY cells (40 s duration) shows alternating epochs of fast run and slow bursting. C, [K+]o increased during fast run and decreased during slow bursting. The upper switching point for transition from fast run to slow bursting and the lower switching point for transition from slow bursting to fast run correspond to hysteresis endpoints in A. D, Membrane voltage time course of PY cell (top trace) and of IN (bottom trace).