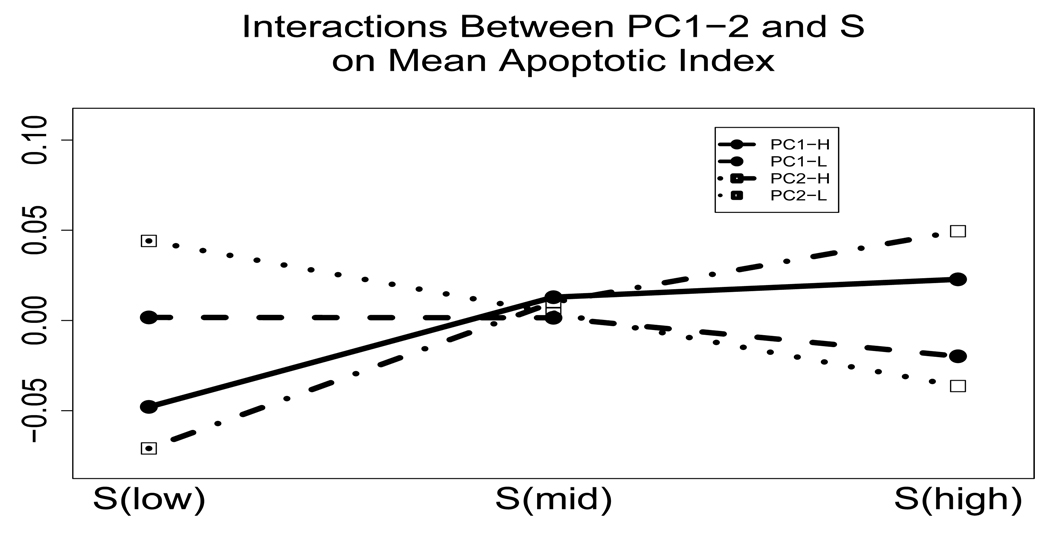
Figure 6.
Interaction between levels of the first two principal components and level of the function S(·). Here ”PC1” and ”PC2” are the first and second principal components, respectively, while subscripts ”Low” and ”High” indicate whether they are below or above the fiftieth percentile. The terms S(low), S(mid) and S(high) refer to low, medium and high values of S(·). The solid line refers to PC1-High, the dashed to PC1-Low, the dash-dotted to PC2-High and the dotted to PC2-Low.

