
Fig. 1.
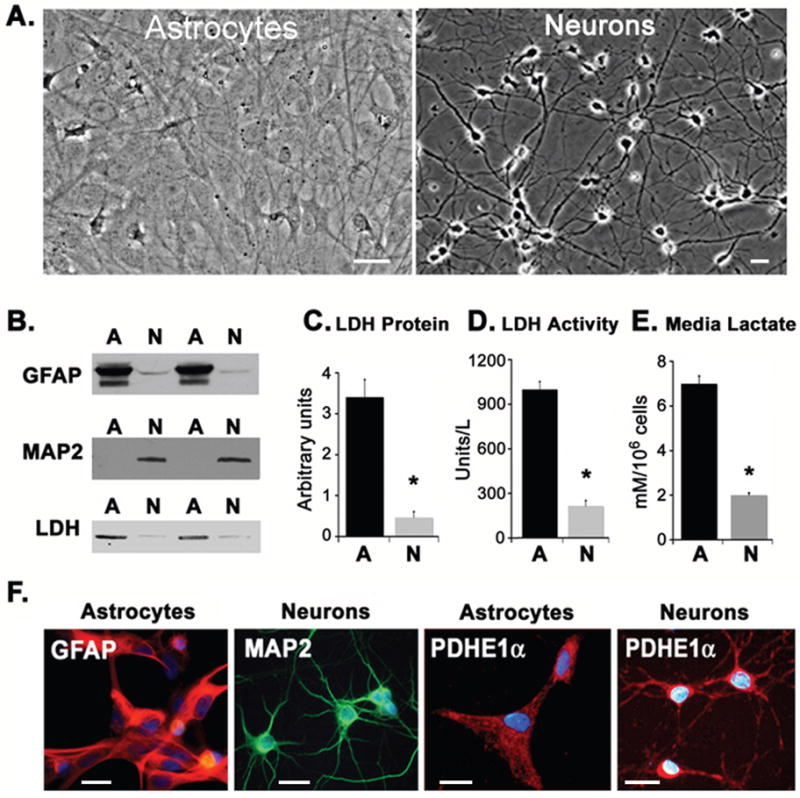
Characterization of primary cortical cultures. (A) Phase-contrast images illustrating the typical morphologies of cultured astrocytes (left) and neurons (right). (B) Western blots illustrating the relative expression of astrocyte-specific (GFAP, top) or neuron specific (MAP2, middle) markers or LDH (bottom) immunoreactivity. Duplicate samples are shown. (C) Densitometric analysis of LDH blots. Data are representative of quadruplicate measurements from three independent cultures. (D) LDH enzymatic activity expressed as units/liter for equivalent amounts of cell protein from astrocytes (dark bars) and neurons (light bars). (E) Lactate release into culture medium by astrocytes (dark bars) and neurons (light bars). Neuronal cultures showed significantly lower LDH levels and lactate production (asterisks). (F) In the left panels, cultures were double-stained with antibodies against GFAP (red) and MAP2 (green). Nuclei are labeled with DAPI (blue). Astrocyte cultures showed prominent immunorecativity for GFAP (red) but not MAP2, while neurons show immunoreactivity for MAP2 (green), but not GFAP (red). In the right panels, both types of cell cultures showed immunoreactivity for PDHα (red). Scale bars = 20μm.