
Figure 5.
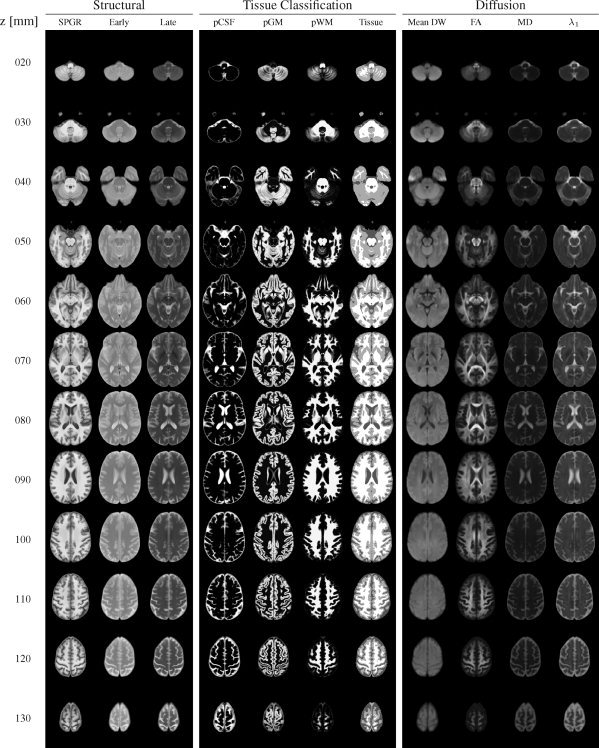
Axial slices through the channels of the SRI24 atlas in 10 mm increments, from z = 20 mm (inferior) to z = 130 mm (superior). The structural image channels are grouped on the left, the tissue segmentation channels are grouped in the center, and the diffusion‐related channels are grouped on the right. Columns from left to right: SPGR, early‐echo FSE, late‐echo FSE, CSF probability map, GM probability map, WM probability map, tissue label map, mean DWI, FA map, MD map, λ1 map.