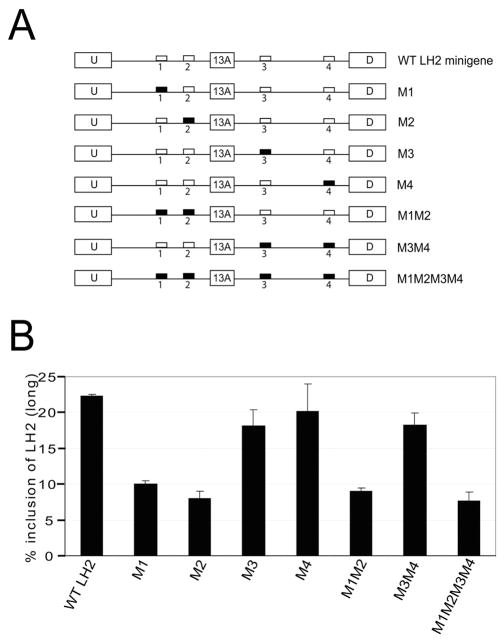
Figure 4. Mutation of the Fox binding motifs located upstream of the exon 13A in the LH2 minigene leads to a significant reduction in the levels of LH2(long).
(A) Schematic representation of the different mutations of the Fox binding motifs that were used for the mutagenesis experiment shown below in 4B. The white boxes represent wild-type Fox binding motifs and the black boxes represent the mutated Fox motifs. The name of each construct is shown on the right hand side.
(B) The bar graph shows the quantification of a stable transfection experiment in MEFs with LH2(long) mRNA shown as a percentage of the total, [LH2(long) + LH2(short)], as described in Materials and Methods. The graph depicts the result of three independent wells with ± Standard Deviation (SD) shown in the error bars. Each experiment was performed twice in triplicate.

