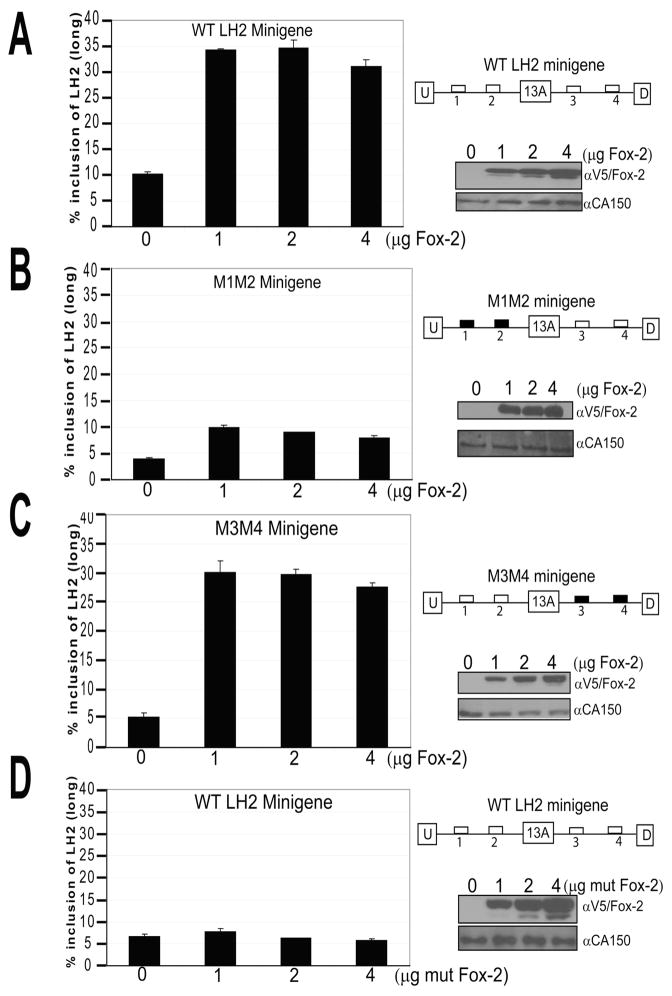
Figure 5. Over-expression of Fox-2 results in significantly increased LH2(long) levels when the upstream Fox-2 binding motifs are intact, irrespective of the status of the downstream motifs.
Bar graphs representing the results of transient transfection experiments in A431 cells in which 100ng of (A) WT LH2 minigene, (B) M1M2 LH2 minigene in which upstream Fox binding motifs were mutated and, (C) M3M4 LH2 minigene in which downstream Fox binding motifs were mutated, were co-transfected together with increasing amounts of WT Fox-2 cDNA, respectively. In (D), 100ng of WT LH2 minigene was co-transfected together with increasing amounts of a mutated Fox-2 cDNA. The quantification of LH2(long) mRNA has been described in Figure 2 and in Materials and Methods. The schematic representation of each minigene used in each experiment is shown on the right. The western blots for each individual experiment are shown below the minigene schematic. V5 antibody was used to detect the induced Fox-2. CA150 was used as a loading control. All the graphs are the result from three independent wells with ± Standard Deviation (SD) shown in the error bars. Each experiment was performed twice in triplicate.

