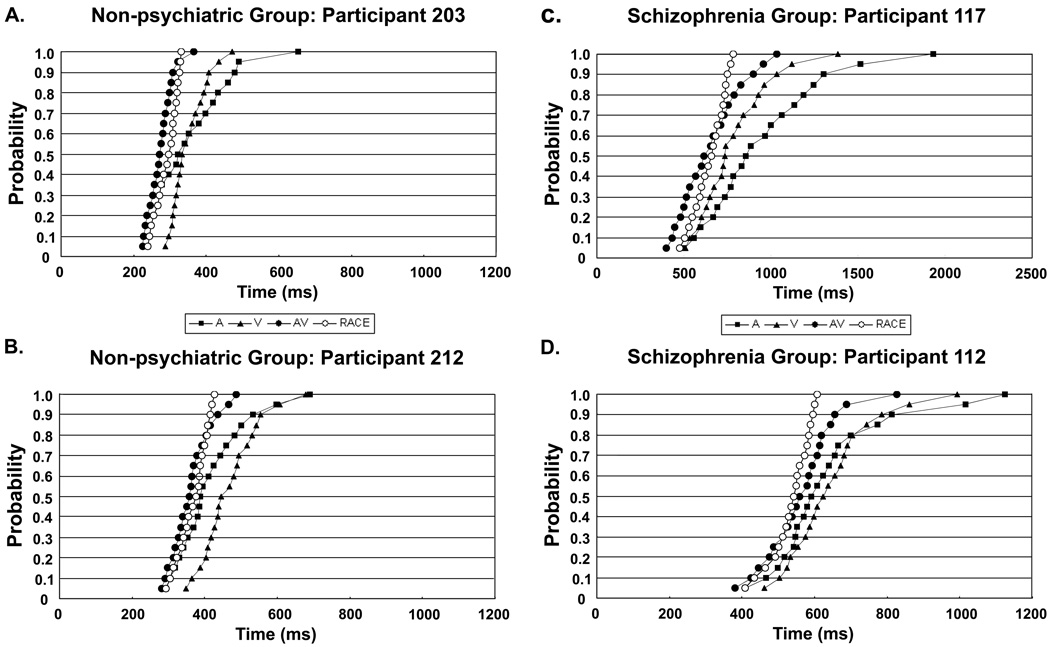
Figure 3.
Cumulative density functions of reaction times (RTs) for target detection with three cue types; unimodal Auditory (A), unimodal Visual (V) and bimodal Auditory + Visual (AV) as well as Race Model predictions (RACE) based on sum of unimodal RT curves. Panels A and B show data from two individual non-psychiatric participants, and panels C and D show data from two individual patients with schizophrenia. All participants showed similar patterns of RTs, with Auditory and Visual curves that were slower than both the AV and race model prediction curves, though individual participants varied in the extent to which the AV curve is shifted in the faster direction relative to the race model prediction.

