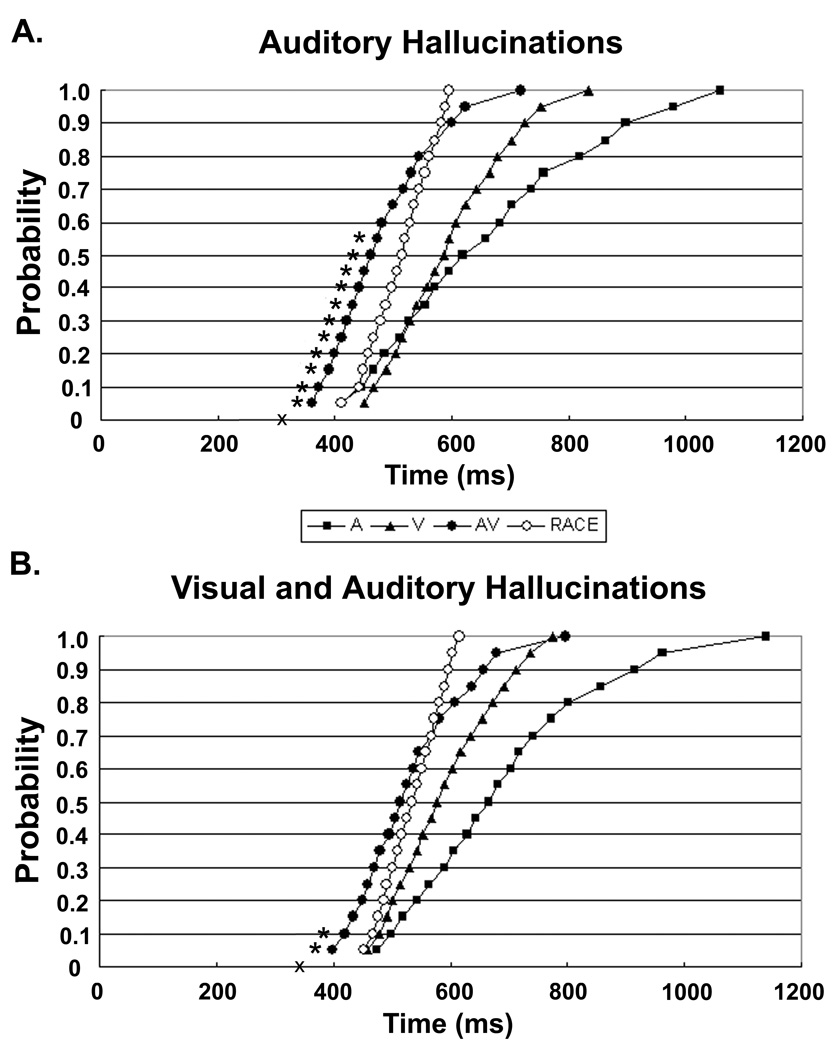
Figure 4.
Cumulative density functions of reaction times (RTs) for target detection with three cue types; unimodal Auditory (A), unimodal Visual (V) and bimodal Auditory + Visual (AV) as well as Race Model predictions (RACE) based on unimodal RT curves. Panel A shows the data for patients with schizophrenia who have experienced only auditory hallucinations, and panel B shows the data for patients who have experienced both visual and auditory hallucinations. The percentiles for which the AV curve violates the race model for each group using a paired t-test (p <. 05) are marked with a star, Bonferroni corrected violation percentiles are also marked with an X. Schizophrenia patients who have experienced both auditory and visual hallucinations show intersensory facilitation of reaction time over less of the curve, up to only the 10th percentile, compared to non-psychiatric individuals who show race model violations up to the 55th percentile.

