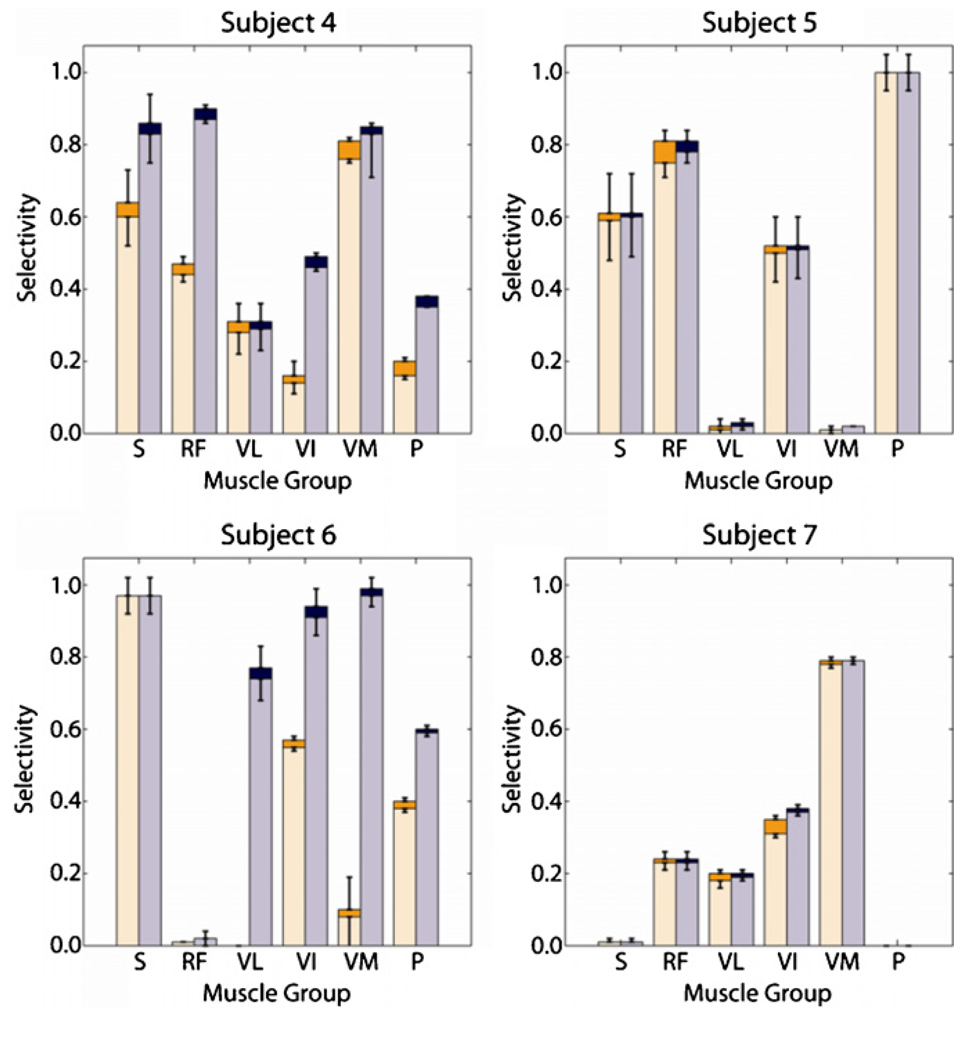
Figure 6.
The maximized selectivity (lower of stacked bars) and corresponding recruitment (higher of stacked bars) for each muscle within each subject is shown under two regimes: (1) costs were a function of all non-target muscles and did not exceed 10% for any non-target muscle (left of grouped bars) and (2) costs were a function of all non-agonist muscles and did not exceed 10% for any non-agonist muscle (right of grouped bars). Subject 7 did not exhibit pectineus twitches.

