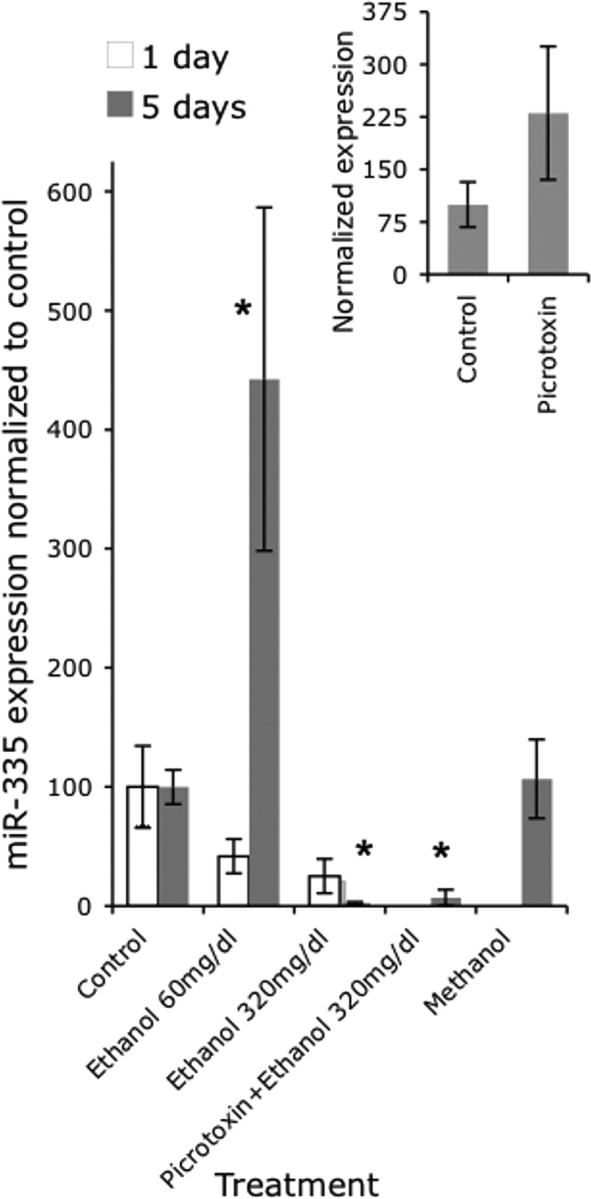
Figure 5.

Bar graph depicting miR-335 expression using real-time RT-PCR in response two doses of ethanol (60 and 320 mg/dl) at two different time points (1 and 5 d). At 5 d, the low dose caused a statistically significant induction, whereas the high dose caused a statistically significant suppression of miR-335 expression compared with controls. Concurrent exposure to picrotoxin did not prevent the suppression in miR-335 expression induced by the high dose of ethanol compared with controls. Methanol at 320 mg/dl for 5 d did not alter miR-335 expression. The inset graph indicates that picrotoxin by itself (at 100 μm for 5 d) did not induce a statistically significant change in miR-335 expression. The y-axis indicates normalized miRNA expression (expressed as , normalized to the mean expression in control cultures, as in Fig. 4). Data were expressed as mean ± SEM. Asterisks indicate statistical significance compared with controls; p values are as indicated in the text.
