
FIGURE 2.
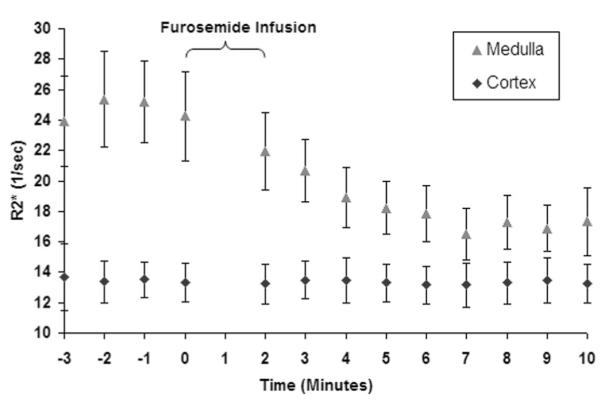
A graphical representation of the R2* values as a function of time obtained in one representative subject. The first 4 points represent the mean baseline R2* values. Zero on the time axis represents the time of furosemide administration. The errors bars represent the standard deviation of the pixel data for all of the regions of interest used to determine a single time point. Note that the cortical R2* remain relatively constant over the entire acquisition period, whereas medullary R2* approaches that of the cortex after administration of furosemide.