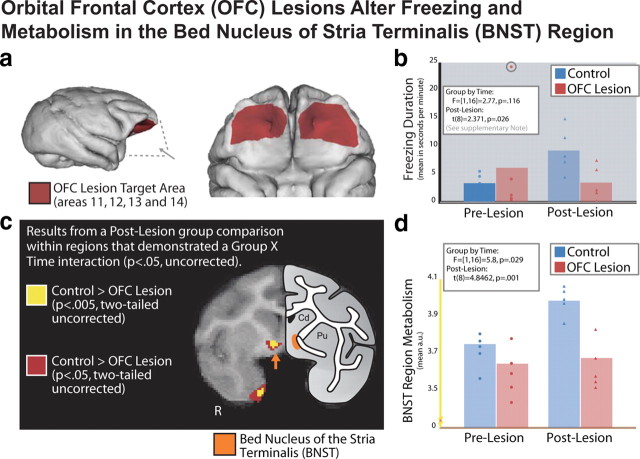
Figure 1.
OFC lesions alter freezing and metabolism in the BNST region. a, Five animals received lesions to the OFC [Walker areas 11, 12, 13, and 14; these lesions are discussed in detail in Kalin et al. (2007)]. b, Bar plot with individual data points representing a lesion/no lesion by time-1/time-2 interaction for freezing duration assessed in the no-eye-contact condition during FDG uptake (for details on this analysis, see Results and supplemental material, available at www.jneurosci.org). Details on the extreme outlier in the control group at time 1 (circled) can be found in the supplemental material (available at www.jneurosci.org). c, Results from a corresponding voxelwise analysis of brain activation, in which we observed a lesion/no lesion by time-1/time-2 interaction (p < 0.05 two-tailed uncorrected) and a significant difference at time 2 (p < 0.05 and p < 0.005, two-tailed uncorrected; seen in red and yellow, respectively). Results are overlaid on a study-specific template discussed in Kalin et al. (2005), and shown next to a schematic that demonstrates the location of the BNST region according to Paxinos et al. (1999). d, Bar plot with individual data points representing the lesion/no lesion by time-1/time-2 interaction for the mean FDG values within the BNST-region cluster (shown in yellow in c).

