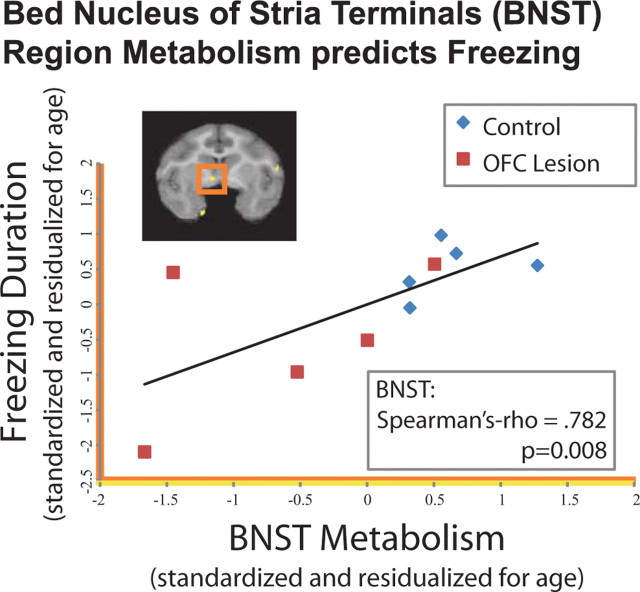
Figure 2.
BNST region metabolism predicts freezing. Scatter plot demonstrating that the relationship between freezing duration (log-scaled, residualized for age, and z-scored) and mean FDG values at time 2 from the functionally defined BNST region (residualized for age and z-scored; p < 0.005 two-tailed uncorrected, yellow in Fig. 1c and brain overlay; residualized for age and z-scored). These values represent a replication of the relationship between BNST region metabolism and freezing duration previously reported in Kalin et al. (2005) across the OFC-lesioned animals and their cage-mate controls.

