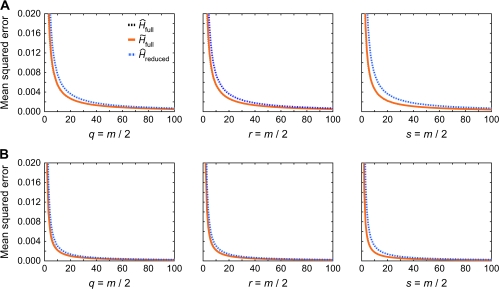
FIG. 1.—
MSE as a function of sample size m for three different estimators. Each plot in a given row represents samples with a different type of relative pair. The numbers of parent–offspring, full-sib, and second-degree pairs are denoted by q, r, and s, respectively. The full and reduced samples contain m and m/2 individuals, respectively. The curve is almost directly on top of the curve. (A) Allele frequencies simulated based on observed frequencies at locus AAT263P (H = 0.6778). (B) Allele frequencies simulated based on observed frequencies at locus ACT3F12 (H = 0.8263). The range of the plots is truncated at 0.02, so that the MSE for small sample sizes is not shown. Each point in the graphs is based on 100,000 simulated data sets, and the same simulated data were used for all three estimators.

