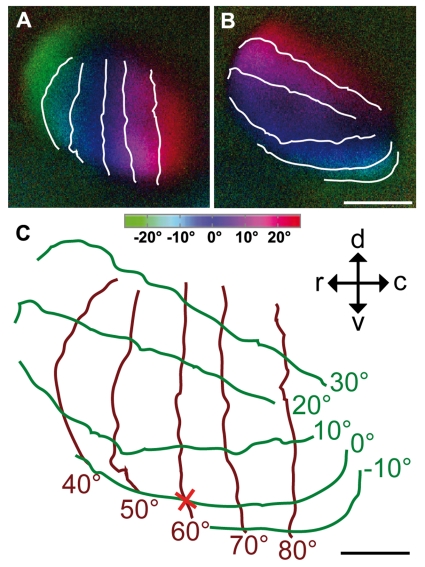
Figure 4. Colour-coded polar maps of retinotopy in the optic tectum superimposed with iso-azimuth and iso-elevation lines.
An azimuth (A) and an elevation retinotopic polar map (B) are superimposed by iso-azimuth and iso-elevation lines indicating the alignment of visual field vertical and horizontal contours on the surface of the brain (C). The position of the fovea is indicated by a red cross. Iso-azimuth is plotted by brown lines, iso-elevation by green lines. The contours overlying the images have a spacing of 10°. The isolines drawn over dark blue regions correspond to lines running through the centre of the stimulus monitor (0° on colour coding). The monitor was horizontally centred at the angle of the fovea (60°), but the horizontal through the bird's eye lay 9° below the horizontal centre line of the monitor, consequently, so does the fovea in (C). The inset in (C) indicates the orientation of the activity patches within the optic tectum, viewed from the side. c, caudal; d, dorsal; r, rostral; v, ventral. Scale bar (A) and (B) = 1 mm. Scale bar (C) = 500 µm. Monitor distance d = 40 cm, α = 54° (see Figure 1).

