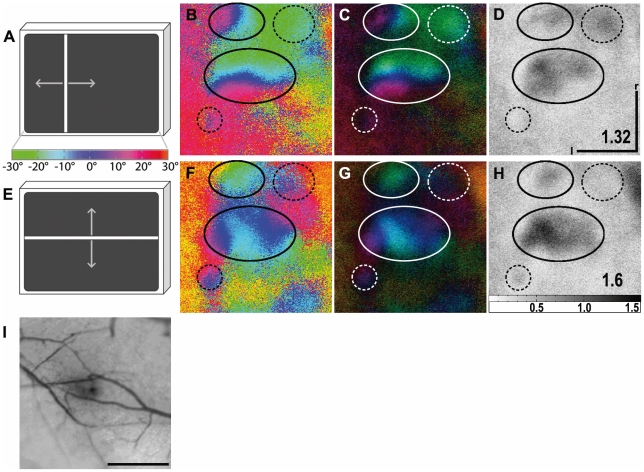
Figure 8. Maps of multiple visual areas recorded with intrinsic signal optical imaging in the visual wulst.
(A and E) Schematic illustration of the visual stimulus and a colour coding used to visualise the wulst response with either vertical (azimuth stimulus, A) or horizontal moving bars (elevation stimulus, E). Colour-coded phase (B, F) and polar maps of retinotopy (C, G) and grey-scale-coded response magnitude maps (D, H) are illustrated. The magnitude of the optical responses is illustrated as fractional change in reflection×104: the darker the activity patch the more active was the corresponding brain region. The absolute magnitude of the darkest spot within the activity patch is given as a number in the lower right corner in the graphs. Neuronal activity elicited by visual stimulation with moving vertical (B–D) and horizontal bars (F–H) are illustrated. Activity patches are marked by circles. Dashed circles mark the position of additional non topographical and weakly activated regions. In (B) two distinct retinotopic activity patches can be distinguished. A large, strongly activated one (see (D)) and a smaller, weaker one located anterior to the large patch and shifted in its relation to the large patch. In the elevation phase map (F) the strongly activated patch (see (H)) is also the larger of the two marked activity patches. The retinotopic colouring, however, somehow appears to be mirrored, which might indicate the large patch in (F), and therefore also that in (B), to be composed of two smaller patches. In (I) the surface vascular pattern corresponding to the representation in (B) to (D) and (F) to (H) is shown. l, lateral; r, rostral. Scale bar in (B) to (D), (F) to (H) and (I) = 500 µm. Monitor distance d = 35 cm, α = 60° (see Figure 1).

