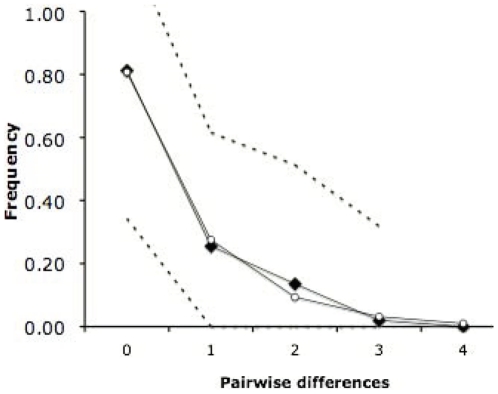
Figure 3. Mismatch distribution from the whole diploid Artemia parthenogenetica dataset.
The solid black line with black squares indicates the observed distribution, and the solid black line with the white circle indicates the simulated distribution based on the sudden expansion model performed with Arlequin software. Dashed lines represent the upper and lower confidence intervals (α = 0.05) based on 1000 pseudo-replicates.

