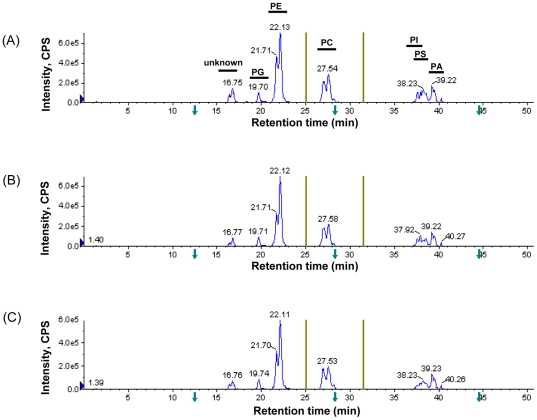
Figure 3. Multi-stage MRM analysis of individual lipids in each class (listed in Table S1) after normal-phase LC separation.
(A) wild type; (B) ΔCST26; (C) ΔSLC1. PG, phosphatidylglycerol; PE, phosphatidylethanolamine; PC, phosphatidylcholine; PI, phosphatidylinositol; PS, phosphatidylserine; PA, phosphatidic acid. Y-axis: intensity, counts per second (CPS). The Olive lines on the left and right side of PC show switching time points for scheduled MRM transitions.

