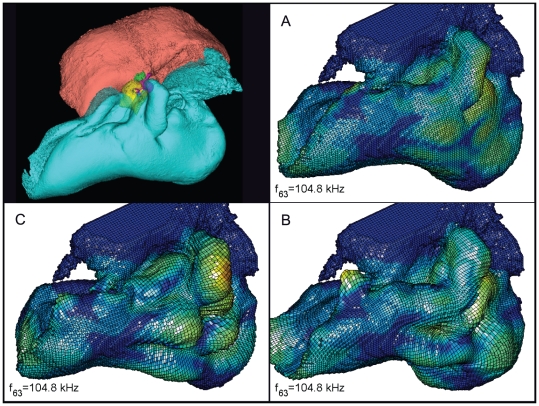
Figure 22. The vibrational pattern representing the 63rd natural mode of vibration at 104.8 kHz.
This figure contains three additional panels for the reader that does not have facilities to display the animation sequences or are working from a (motionless) hard copy. The three panels show the two extremes of the oscillation sequence (A and C), as well as the midpoint of the sequence (B). By careful examination and comparison of these three panels, the reader should be able to understand the range of motion in the animation. This figure is linked to the animation sequence that depicts the vibrational mode (Figure S22). The vibrations have been exaggerated for easier viewing (see methods section).

